How is the United States doing on improving its overall energy productivity? The International Energy Agency’s (IEA) 2019 review of energy policies in the U.S., published last month, provides some helpful charts for seeing the big picture.
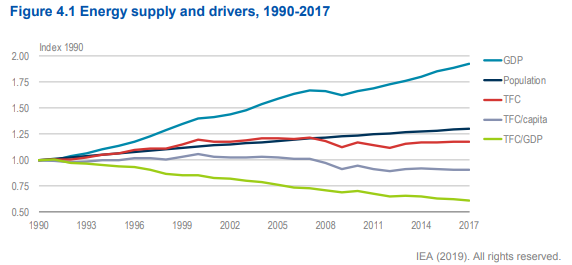
The IEA first presents the energy productivity story by charting the national figures for energy, population, and the economy (with “TFC” meaning total final energy consumption):

The trend is one that has noted before: the economy has grown significantly while energy use has remained relatively stable. The green line shows the decline in energy intensity, the inverse of energy productivity. This is the good news.
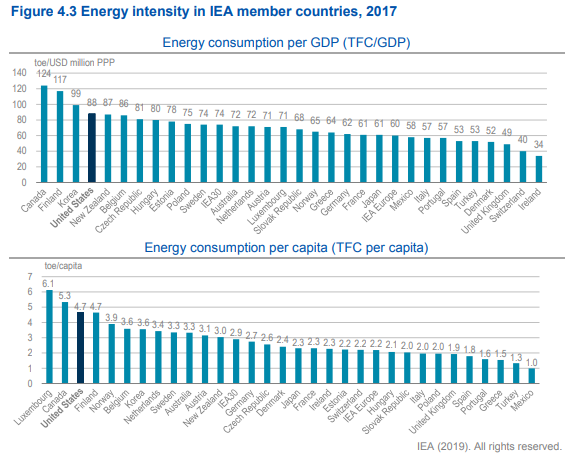
The story turns a bit dimmer when the IEA steps back and looks at how the United States is doing compared to other countries:

The charts, of course, don’t show all nations; IEA member countries are disproportionately wealthy nations, like the United States.
As the IEA plainly puts it, “Despite energy efficiency improvements in recent years, the United States has among the highest energy-intensive economies in the IEA, measured both per GDP and per capita.”
In other words, we’ve got our work cut out for us.
This was originally posted on the Alliance to Save Energy’s blog on 10/09/2019.

